

Usage Analytics Support for Microsoft 365 Admins: Check Roles First
Fix missing Microsoft 365 usage analytics data by checking admin roles, report settings, Power BI licenses, refresh timing, and support ticket evidence.


If you cannot see usage data in your Microsoft 365 reports, first confirm your org’s Reports setting, your assigned admin role, and your Power BI license. Missing data can trace back to causes such as the org-level Reports data opt-in being off, a missing admin role, or the Power BI template app still running on sample data. Add to that the default privacy setting that hides user names, plus a specific monthly refresh cadence for activity details, and most “empty dashboard” tickets resolve quickly once you check Org Settings > Services > Reports.
TL;DR:
- Access requires Report Reader, Exchange Admin, SharePoint Admin, or Global Reader, plus Power BI Pro for both sharer and viewer unless content uses Premium capacity.
- Connect the template app immediately after enabling tenant reporting; collection takes two to 48 hours, and the first dashboard load needs 2 to 30 minutes.
- The User Activity tab refreshes only after the 15th and on the first of the next month, so a midmonth blank does not indicate failure.
- Names are concealed by default; only a Global Administrator can reveal them tenant wide, so limit identifiable reporting access to staff who need it.
- Graph exports can run unattended with application authorization; delegated access requires tenant admin consent and a Reports Reader or Global Reader account.
Table of Contents
- Quick checklist: roles, licenses, and prerequisites for usage analytics access
- How to enable data collection and connect the Power BI template app
- Understanding D7, D30, D90, D180 and refresh timing
- Why reports show anonymous names and how to reveal them
- Common refresh and import failures and where to find evidence
- Using the Microsoft Graph reports API for custom exports
- When to escalate to Microsoft support and what to attach
- Admin best practices for adoption tracking and data retention
- Practical support habits that save time
- An adjacent view: call and support-channel analytics with Orphora AI
- FAQ
- Sources
Quick checklist: roles, licenses, and prerequisites for usage analytics access
Before digging into refresh logs or gateway errors, confirm the basics. Access to the Microsoft 365 Usage Analytics Power BI template app depends on both your admin role and your Power BI license, and skipping this step can lead to wasted troubleshooting time.
- Confirm you hold one of the roles that grants access: Report Reader, Exchange Admin, SharePoint Admin, or Global Reader.
- Check that you have a Power BI Pro or Premium license, since both the person sharing the report and the person viewing it need Pro unless the content sits in Premium capacity.
- Verify role assignment under Microsoft 365 admin center > Users > Active users > [select user] > Roles.
- Confirm license assignment under Billing > Licenses or the user’s profile page.
- Remember that opening the template app without a tenant connection only shows sample data, which looks like a real dashboard but is not.
How to enable data collection and connect the Power BI template app
Turning on usage analytics involves opting in at the tenant level, then connecting the Power BI template app to pull that data into a dashboard.
- Go to Microsoft 365 admin center > Settings > Org Settings > Services > Reports.
- Enable “Make report data available to Microsoft 365 usage analytics for Power BI” and select Save.
- Confirm you are signed in as a Global administrator or one of the roles listed above, since that is required to start and connect the template app.
- Copy your tenant ID from the admin center for reference during setup.
- Open Power BI > Apps > Get apps, search for Microsoft 365 usage analytics, select Get it now, then choose Connect and complete the OAuth2 sign-in.
Expect data collection to take two to 48 hours to complete after enabling the setting, with the initial dashboard load typically finishing within 2 to 30 minutes once data is available.
Pro Tip: Connect the template app right after enabling the org setting, even if the dashboard stays blank for a day. Waiting to connect it later just delays the clock on data collection.
Understanding D7, D30, D90, D180 and refresh timing
Many usage reports let you choose an aggregation window of 7, 30, 90, or 180 days, and picking the right one changes how trends look. A D7 view shows short-term spikes, while D180 smooths out seasonal noise, which matters when you are deciding whether a usage drop is a real problem or a weekend blip.
- Reports generally become available within 24 to 72 hours of enabling the feature.
- The User Activity tab specifically refreshes only after the 15th of the month and again on the first of the next month, so a blank tab mid-month is expected behavior, not a failure.
- For data older than the built-in windows allow, export through the Microsoft Graph reports API and store it in your own reporting system.
One stat worth remembering: the Microsoft Graph API supports D7, D30, D90, and D180 intervals for historical reporting, which is the same window structure used across most usage analytics dashboards, making it straightforward to match API exports to what you see on screen.
Why reports show anonymous names and how to reveal them
Since September 1, 2021, Microsoft has concealed user, group, and site names in reports by default as a privacy measure, which is why many admins see “anonymous” placeholders instead of real identities the first time they open a dashboard. This is a setting, not a bug, and it is reversible for admins who need entity-level detail for support or compliance work.
- Go to Microsoft 365 admin center > Settings > Org Settings > Services > Reports.
- Clear the checkbox for “Conceal user, group, and site names in all reports.”
- Select Save to apply the change tenant-wide.
- Confirm you are signed in as a Global Administrator, since no other role can change this setting.
Before revealing names tenant-wide, consider whether only a small group, such as the help desk or security team, actually needs identifiable data, and restrict reporting roles accordingly rather than exposing everyone’s activity by default.
Common refresh and import failures and where to find evidence
When a dashboard looks stale or refuses to refresh, the cause is usually one of a few repeat offenders: gateway connectivity, refresh throttling, or a misconfigured schedule.
- In Premium capacities, refreshes can get throttled under load, so schedule refreshes during nonpeak hours when possible.
- Enable semantic model scale-out and simplify the model where you can, since heavy models increase memory pressure and refresh time.
- Use incremental refresh instead of full refreshes to cut down both duration and the chance of a timeout.
- Pull the Refresh history CSV from the dataset settings page, which lists start times, duration, and failure reasons for each attempt.
- Check gateway logs, typically found under Data Management Gateway or PowerBIGateway log folders, for authentication, timeout, or connectivity errors.
- Try a manual refresh first, confirm gateway credentials are current, and reduce the number of parallel refreshes running at once.
Pro Tip: If a refresh fails intermittently rather than every time, retry after a short delay before assuming the gateway itself is broken. Some transient failures clear after a retry.
Using the Microsoft Graph reports API for custom exports
The Graph reports API is worth setting up when you want to fold usage metrics into an internal reporting system alongside other business data.
- Use application-level authorization for unattended, scheduled exports that run without a signed-in user.
- Use delegated authorization when a specific person is pulling the report, keeping in mind that tenant admin consent is required and the signed-in user must hold a limited admin role such as Reports Reader or Global Reader.
- Request data using the same D7, D30, D90, or D180 period parameters used in the dashboard reports, so your exports line up with what stakeholders already see.
- Follow the download instructions for the report to retrieve its CSV data.
A team building an internal view on top of these exports can explore approaches such as SoftEXIT’s role-based CRM dashboard guide, which covers assembling dashboards without custom development.
When to escalate to Microsoft support and what to attach
If you have checked roles, licenses, the Reports opt-in, and gateway logs and the dashboard still will not populate, it is time to open a support ticket, and the quality of what you attach determines how fast it gets resolved.
- Attach the Refresh history CSV and any relevant gateway logs, since these are the first things support will ask for.
- Include your tenant ID, the exact steps you took, the time windows involved, and screenshots of any error messages.
- Note your Power BI workspace and capacity type (Pro versus Premium) and confirm whether you connected the template app or were only viewing sample data.
- Specify the exact report or tab affected and the date range you attempted to view.
- Provide a short reproduction sequence so support can recreate the issue without back-and-forth.
Admin best practices for adoption tracking and data retention
Beyond fixing broken dashboards, a few habits keep usage analytics useful over time rather than just functional in the moment.
- Use Adoption Score alongside group-level aggregates to see trends by department, when group-level insights are enabled for your tenant.
- Default to least-privilege roles for anyone who needs reporting access, and keep a written record of who holds which role for audit purposes.
- Export Graph API data on a schedule and join it with Active Directory attributes so you can slice usage by department or location instead of only by tenant-wide totals.
Pro Tip: Set a recurring calendar reminder to review role assignments quarterly. Reporting access tends to accumulate over time as people change teams, and nobody remembers to remove it.
Practical support habits that save time
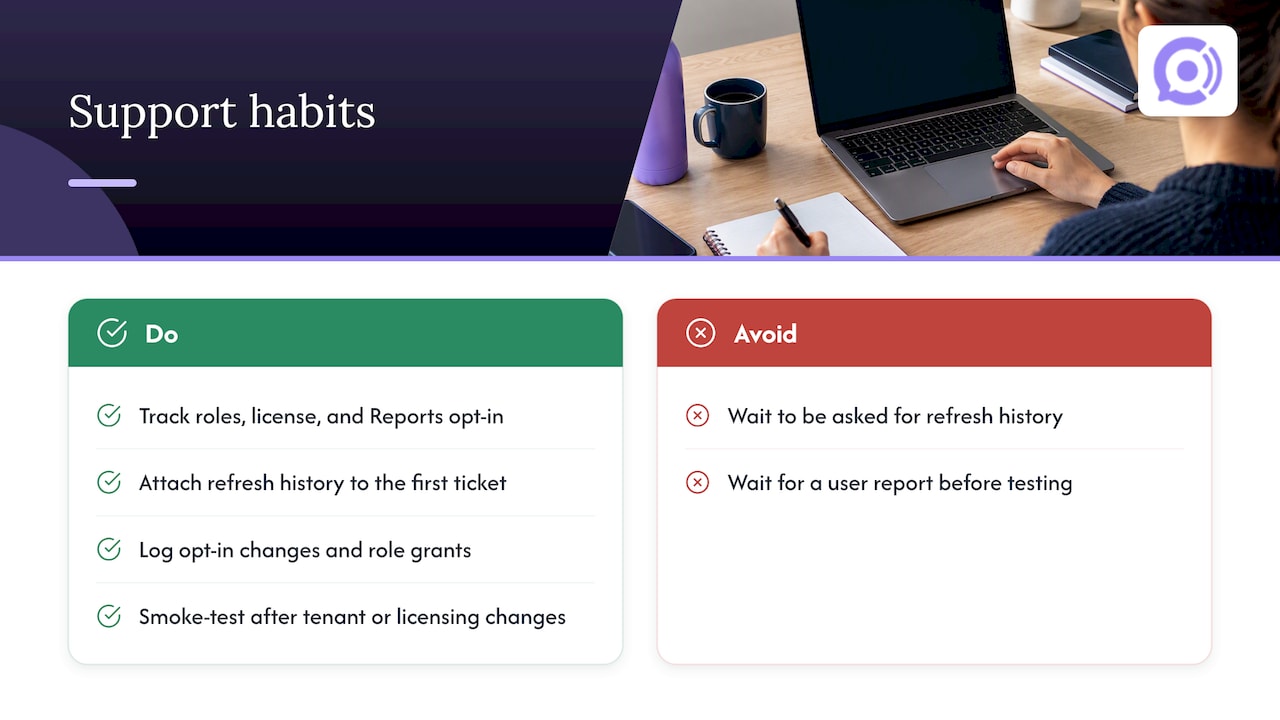
Keeping a short tenant-level checklist, covering roles, license status, and the Reports opt-in state, can make an investigation quicker. Attaching refresh history to the very first support ticket, rather than waiting to be asked for it, cuts resolution time noticeably.
Logging every change to the Reports opt-in setting and every role grant gives you a timeline to reference when something breaks months later. After any tenant or licensing change, a quick smoke test of the dashboard catches problems before a user reports them.
— Orphora AI
An adjacent view: call and support-channel analytics with Orphora AI
Microsoft 365 usage analytics tells you how people use tenant services, but it has nothing to say about what happens on a support phone line. For e-commerce stores running on WooCommerce, we built AI Voice Agent to handle customer calls around the clock, with call analytics and transcripts.

The service provides call analytics and order lookups, which complement tenant-level Microsoft reporting rather than replacing it. Plans start at $9.99 per month per agent plus $0.10 per conversation minute, and you can see the full capability set on our features page or get in touch for a walkthrough.
FAQ
What are the three types of analytics?
Analytics can describe what happened, help investigate why it happened, or explore what may happen next. Microsoft 365 usage analytics sits mostly in the descriptive and diagnostic categories, showing adoption and activity patterns across services like Exchange, SharePoint, and Teams.
How do I activate Microsoft 365 usage analytics?
Go to the Microsoft 365 admin center’s Org Settings, open Services > Reports, and enable the option to make report data available to usage analytics for Power BI. After saving, connect the Power BI template app using an account with Global Administrator or one of the required admin roles.
Do I need to pay for a Power BI account to view these reports?
Yes, viewing the Microsoft 365 Usage Analytics template app requires a Power BI Pro or Premium license for both the person sharing the report and the person viewing it, unless the content is hosted in Premium capacity. Check Microsoft’s current licensing guidance to confirm which license applies to your setup.
What makes a good analytics dashboard for support teams?
A useful dashboard surfaces trends at a glance, lets you drill into specific time windows like the last 7 or 30 days, and ties activity data to real identities rather than anonymized placeholders where privacy settings allow it. For support-specific work, call analytics for WooCommerce stores adds a layer that tenant-wide usage reports do not cover.
Why do my Microsoft 365 reports show anonymous names instead of real users?
This happens because Microsoft conceals user, group, and site names in reports by default as a privacy setting. A Global Administrator can clear this setting under Org Settings > Services > Reports to reveal real names in future reports.