

Contact Centers: Cut Call Queue Abandonment With a 30/60/90 Plan
Playbook to cut call queue abandonment using delay bands, Erlang A staffing, a 30/60/90 rollout, callbacks, IVR fixes, and targeted automation.


Call queue abandonment happens when a caller hangs up before reaching an agent, and the standard way to measure it is abandoned calls divided by total calls offered. It matters because every abandoned call costs you a repeat contact, a support ticket, or a churned customer, on top of the wasted staffing minutes already spent ringing that line. Before changing anything operationally, confirm your reporting platform’s definitions and data lineage. Most abandonment problems trace back to inconsistent measurement before they trace back to staffing.
TL;DR:
- Most abandonment issues stem from inconsistent measurement and poor data lineage rather than staffing levels, making proper reporting crucial.
- Abandon-delay banding helps diagnose root causes, distinguishing between quick exits due to IVR frustration and longer waits caused by staffing or routing issues.
- Queue-specific targets matter; technical and urgent support lines need lower abandonment rates than sales queues, which tolerate higher levels due to lower urgency.
- Erlang-C significantly underestimates staffing needs in centers with meaningful abandonment because it assumes callers wait indefinitely, ignoring real demand exits.
- Automating high-volume, low-complexity queries and using callbacks can drastically reduce queue demand and abandonment, but tracking downstream effects is essential.
Table of Contents
- What Counts as Call Queue Abandonment?
- What’s a Good Call Abandonment Rate?
- Why Do Calls Get Abandoned? Root Causes and Diagnostics
- How Do You Measure Abandonment Without Double-Counting?
- Which Tactics Actually Reduce Abandonment?
- Why Erlang-C Understates Your Staffing Needs
- A 30/60/90 Plan to Bring Abandonment Down
- Treating Abandonment as One Signal, Not the Whole Story
- Reducing the Calls That Never Needed a Queue
- Sources
- FAQ
What Counts as Call Queue Abandonment?
The standard formula is simple: abandoned calls divided by total calls offered, expressed as a percentage. Total calls offered includes every call that entered the queue, whether it was answered, abandoned, or diverted to a callback. Government reporting guidance for call centers uses this exact framing and recommends weighted averaging when combining rates across multiple queues or sites, since a straight average overstates the impact of small, high-abandonment queues.
Getting the denominator right matters more than most managers assume:
- Exclude short or false abandons, typically calls that hang up in the first 5 to 10 seconds, since these usually reflect misdials or accidental taps, not real wait frustration.
- Count callback requests as abandoned only if the caller never connects to a live agent through either channel; otherwise you inflate the rate.
- Treat voicemails and retries as separate events in your reporting, not as automatic non-abandons, so repeat attempts by the same caller don’t get counted twice.
What’s a Good Call Abandonment Rate?
There is no single acceptable number. Most general customer service lines run at moderate levels without raising alarms, and that range still counts as healthy if resolution and satisfaction scores hold steady.
Rate expectations shift by queue purpose, and treating every line the same way hides real problems:
- Sales queues tolerate higher abandonment because callers with lower urgency self-select out, and a missed sales call rarely produces the same downstream cost as a missed service call.
- Technical support and urgent care lines need tighter bands, since abandoned calls there often turn into repeat contacts, refund requests, or safety issues.
- A center-wide average can mask a single broken queue running at 20% abandonment while three healthy queues pull the blended number down to something that looks fine on a dashboard.
Benchmark each queue against its own history and intent, then roll those numbers up with a weighted average rather than a flat mean.
Why Do Calls Get Abandoned? Root Causes and Diagnostics
Abandonment rarely has one cause, and treating it as a single problem leads to the wrong fix. The most useful diagnostic tool is abandon-delay banding: breaking abandoned calls into intervals (0 to 15 seconds, 15 to 30, 30 to 60, over 60) so you can see where callers are giving up. Genesys-style interval reporting uses exactly this structure, and it separates two very different problems: someone abandoning at 8 seconds hit a dead-end menu or misdial, while someone abandoning at 90 seconds simply ran out of patience.
Work through diagnostics in this order:
- Pull abandon-delay bands first. A spike in the 0 to 15 second range usually points to IVR friction or routing errors, not staffing.
- Overlay arrival volume against schedule adherence. Abandonment spikes that line up with unscheduled breaks or adherence gaps are a staffing problem wearing a queueing costume.
- Check average handle time and transfer rates for the same interval. Rising AHT eats capacity even when headcount hasn’t changed, and every unnecessary transfer adds queue time to the next leg of that call.
- Flag repeat contacts within a short window. A caller who abandons, calls back within an hour, and abandons again usually reflects an intent mismatch, the queue or IVR path didn’t match what they actually needed.
How Do You Measure Abandonment Without Double-Counting?
The biggest measurement failure in most contact centers isn’t a wrong formula, it’s uncontrolled duplication. A caller who abandons, requests a callback, and then abandons the callback too can show up as three separate abandonment events if your reporting doesn’t track lineage. Building a contact-level lineage map, inbound call, IVR path, queue entry, callback or voicemail, retry, before changing anything else keeps your abandonment KPI honest and auditable.
Two practices fix most of this:
- Include valid abandons (excluding short/false ones) in your offered-demand figure when feeding workforce planning models, since undercounting real demand leads to permanent understaffing.
- Report callback performance as its own metric set: offer rate, acceptance rate, completion rate, cancellation rate, and callback abandonment, rather than folding callback outcomes into your primary queue abandonment number. AWS Connect’s callback reporting fields illustrate this separation well, tracking offered, handled, and attempted callbacks as distinct counts.
Pro Tip: Before you launch any callback program, ask your reporting vendor exactly which denominator a “callback completed” event gets counted against. If the answer isn’t immediate, you already have a double-counting risk.
Which Tactics Actually Reduce Abandonment?
Fixes fall into a rough order of impact versus effort, and most centers get more traction from the first three than from headcount alone.
- Queued callbacks and virtual queues let callers hold their place in line without staying on the phone. Configure them to trigger after a defined wait threshold, and count callback completions and cancellations separately from your primary abandonment rate so the improvement is measurable rather than assumed.
- IVR simplification removes dead-end menu branches that generate 0 to 15 second abandons. If a caller can’t reach a human or a self-service resolution within two or three menu choices, that branch needs to go.
- Intraday staffing and adherence discipline close the gaps that show up as abandonment spikes tied to breaks, meetings, or unplanned absences. This is often cheaper to fix than hiring, since it’s a scheduling and coaching problem, not a capacity one.
- Self-service and automation work well for high-volume, low-complexity intents like order status, shipping updates, and return initiation, freeing live queue capacity for calls that genuinely need a person.
- Priority rules and controlled outbound retries route callers with a history of repeat abandonment or higher predicted patience differently. INFORMS research on personalized priority policies found that policies based on individual customer history and predicted abandonment behavior can markedly reduce average waiting time and lost service requests, compared to strict first-come, first-served routing.
Pro Tip: Automation and callbacks only reduce abandonment if you’re also monitoring for downstream effects, like repeat contact rates. A caller who gets a bad self-service loop will call right back and abandon again, and that hides in your data unless you’re tracking it.
Why Erlang-C Understates Your Staffing Needs
Erlang-C, the formula most workforce management tools default to, assumes callers wait indefinitely for an agent. That assumption breaks down the moment real abandonment enters the picture, because Erlang-C has no mechanism to account for demand that leaves the queue before being served. The result is chronic understaffing in centers with meaningful abandonment, since the model was never built to see the calls that disappeared.

Queueing-science research on call center performance recommends Erlang-A or similar abandonment-sensitive models instead. These models incorporate a patience parameter, estimated from your abandon-delay distribution, and treat total offered demand as answered calls plus valid abandons, not just answered calls. Practically, that means your staffing forecast should use the fuller demand number, not the smaller one your ACD reports as “handled.”
A 30/60/90 Plan to Bring Abandonment Down
A sequenced rollout beats trying to fix everything simultaneously, since it isolates which changes actually moved the number.
- Days 1 to 30: Validate your data. Confirm formula consistency, build contact-level lineage, and pull abandon-delay bands to find your worst queues and time intervals. Do not change staffing or routing yet.
- Days 31 to 60: Deploy targeted fixes, routing corrections, IVR trims, and a callback pilot on your highest-volume queue. Track callback completion rate and average speed of answer (ASA) daily.
- Days 61 to 90: Scale automation to low-complexity intents identified in step one, and tune priority rules using the patience data gathered so far. Track abandonment by delay band, repeat contact rate, and CSAT alongside the headline abandonment number.
Treating Abandonment as One Signal, Not the Whole Story
Abandonment tells you something is wrong, but it doesn’t tell you what to fix, and chasing the number down in isolation is a common mistake. A Veterans Health Administration study found that average speed of answer correlated with caller perceptions of timely access, while abandonment rate alone didn’t predict satisfaction on its own. That’s a useful check on instinct: a queue can hit a great abandonment number by adding headcount you can’t sustain, or a mediocre one while resolution quality stays excellent.
The real tradeoff sits between three levers: adding capacity, fixing routing, and deploying automation. Each has a different cost curve, and the right mix depends on your intent breakdown, not on hitting one benchmark number.
— Orphora AI
Reducing the Calls That Never Needed a Queue
Some of the volume driving your abandonment numbers doesn’t need a live agent at all, and that’s the gap Orphora AI is built to close for WooCommerce stores. Order status checks, shipping updates, and return initiations are high-frequency, low-complexity intents that eat queue capacity without needing human judgment.

Orphora AI’s AI voice agents connect directly to your store’s order and customer data, so a caller asking “where’s my order” gets a real-time answer without ever entering the human queue. That’s fewer calls competing for the same agents, shorter waits for the calls that do need a person, and lower abandonment on the queues that matter most.
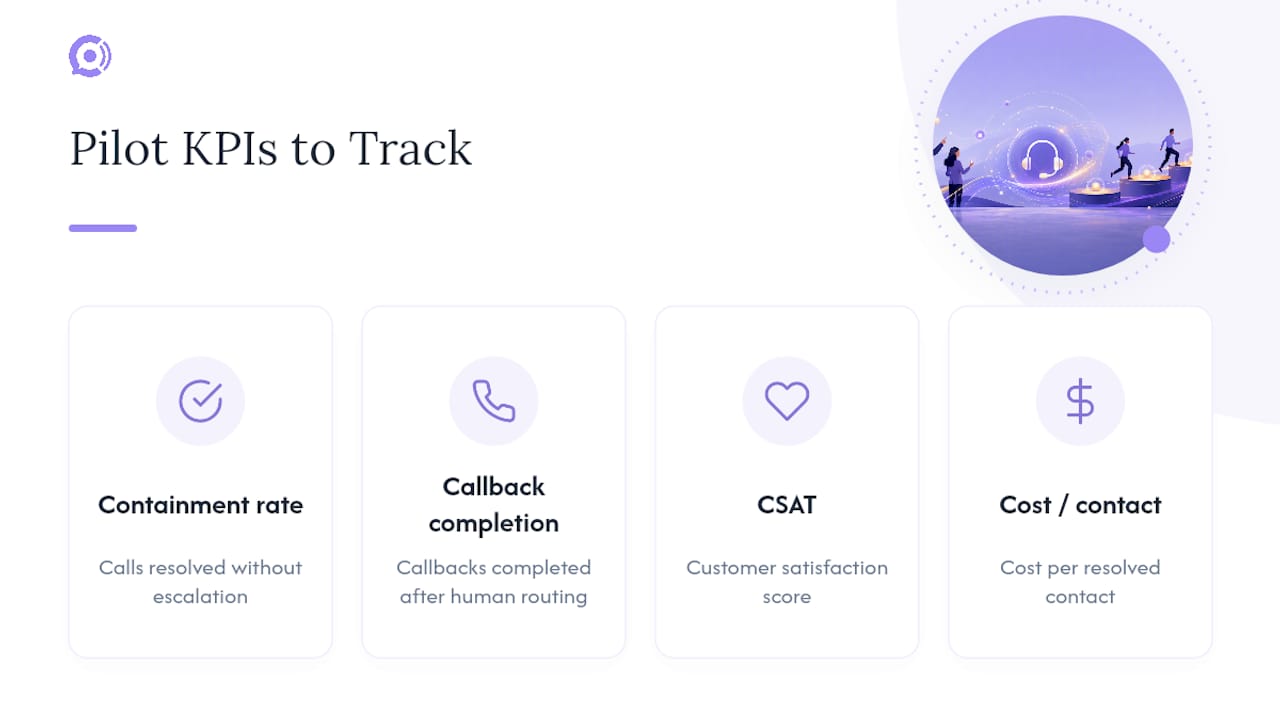
If you’re piloting this kind of eligible-demand reduction, track containment rate (how many calls resolve without escalation), callback completion for the calls that do route to a human, CSAT, and cost per resolved contact. Those four numbers tell you fast whether automation is actually shrinking your queue problem or just moving it. Review the feature set for order lookup and returns handling, then check the installation guide to see what a WooCommerce integration involves before you commit to a pilot.
Sources
For interval-level reporting, review Genesys’s abandon-delay documentation. For calculation standards and weighted averaging, see the Medicaid performance indicators guide. For callback configuration and reporting fields, consult AWS Connect’s setup documentation, and for a broader look at automation planning, see this contact center automation guide.
- Statistical Analysis of a Telephone Call Center: A Queueing-Science Perspective
- Performance indicators data dictionary — Abandonment rate
- Study of Veterans Health Administration call centers (VHA)
- Personalized priority policies — INFORMS research
FAQ
What Is an Acceptable Call Abandonment Rate?
There’s no universal number, but best-in-class service queues run under 3%, and most general customer service lines sit between 5% and 8% without signaling a real problem. Sales and lower-urgency queues can tolerate higher rates, while urgent technical or billing queues need tighter targets since abandons there tend to generate repeat contacts.
What Does “Call Abandonment” Mean?
Call abandonment means a caller hangs up before reaching an agent, whether from queue wait time, IVR friction, or a misdial. The standard measure divides abandoned calls by total calls offered, and most centers exclude very short abandons under 5 to 10 seconds since those usually aren’t genuine service attempts.
What Does It Mean When a Call Is “Queued”?
A queued call has entered the wait line for the next available agent but hasn’t connected yet. Queue time itself isn’t a problem, but the longer a call sits queued past a caller’s patience threshold, the higher the odds it ends in abandonment rather than a completed contact.
How Do I Calculate the Abandonment Rate for a Call Center?
Divide abandoned calls by total calls offered for the same period to calculate a percentage. When combining rates across multiple queues or sites, use a weighted average rather than a simple mean, since a flat average lets small queues distort the overall picture.
Can Automation Actually Lower My Abandonment Rate?
Automation lowers abandonment indirectly by removing eligible calls, like order status or return requests, from the queue before they ever compete for agent time. Tools like Orphora AI’s voice agents handle these routine e-commerce intents around the clock, which shrinks offered demand on the queues where humans are still needed.