

Call Volume Forecasting: A Practical Guide for Small Stores
Learn how to forecast call volume with a spreadsheet: which data to use, which method fits, how to handle promotions, and how to check accuracy.


Call volume forecasting means predicting how many calls will reach your support line in each future hour, day and week, so you can staff for them. For a small online store, you can do it well with a spreadsheet, 12 to 18 months of call history and a calendar of your promotions. This guide shows the data to pull, the methods that fit, how to handle sales and spikes, and how to tell whether your forecast is any good.
TL;DR
- Forecast calls by interval (hourly or half-hourly), not just by day. A correct daily total with the wrong arrival pattern still breaks your schedule.
- Start with recent history, clean out anomalies, and average matching intervals from prior weeks. Add seasonal indices and an event calendar on top.
- Simple methods such as moving averages and weekly regression are often enough for a small store. Complexity rarely pays when your event data is thin.
- Measure accuracy every week and rebuild the forecast regularly. Reforecast the same day when volume runs well over plan.
- If a large share of your calls are order status and returns questions, automating them changes the forecast problem itself.
Table of Contents
- What call volume forecasting is and why it matters
- Gather the right data first
- Choose a forecasting method that fits your size
- Build the forecast step by step
- Account for seasons, promotions and spikes
- Measure accuracy and keep the forecast honest
- What counts as high call volume?
- Perspective: change the volume, not only the forecast
- Using the forecast to decide what to automate
- FAQ
- Sources
What call volume forecasting is and why it matters
Call volume forecasting predicts future incoming contacts, whether calls, emails or chats, by analyzing historical data and finding trends and patterns. Dialpad’s documentation describes it this way, and the purpose is planning: how many people (or how much automation) you need, and when.
The cost of a bad forecast shows up in two places. Understaffed intervals mean long waits, abandoned calls and unhappy customers. Overstaffed intervals mean you pay for idle time. There is also a people effect. A survey from the Society of Workforce Planning Professionals, cited by Assembled, identified forecast accuracy as the top measure affecting team satisfaction, because accurate forecasts spread the workload fairly.
For a store owner or e-commerce manager, the stakes are practical. You might have one person answering the phone, or the phone might ring through to your own mobile. A forecast tells you whether Tuesday at 2 p.m. is a quiet hour you can spend on other work, or whether the week after a promotion needs backup.
Gather the right data first
The forecast is only as good as the history behind it. Here is what to collect.
What to pull from your phone system
The Society of Workforce Planning Professionals recommends using historical ACD reports, ideally two years if available and relevant, to identify trends and seasonal patterns. Include calls offered and handle time by half-hour. If you do not have an ACD, your phone provider’s call log export works: you need a timestamp for each call, its duration and, if possible, the reason for the call.
“Calls offered” matters more than “calls answered.” If callers hung up or got a busy signal, your answered count understates real demand. The same SWPP article notes that periodic busy studies can confirm that calls offered reflect true workload rather than calls blocked by limited trunk capacity.
How much history is enough
More is not always better. Verint’s guidance says that a forecast built on the most recent 12 to 18 months is often more accurate than one built on five years of data that includes outdated patterns. For a store that changed its product line, shipping carrier or return policy, old data may describe a business that no longer exists.
As a floor, Turnella suggests at least 13 weeks of daily data, and 24 to 52 weeks if your business has strong annual seasonality, which most retailers do.
Clean the anomalies
Mark days when something unusual happened: bank holidays, carrier outages, a site incident, a big email campaign. The same Turnella guide advises excluding event-affected periods from your baseline and adding those events back later as separate adjustments. SWPP adds that you should investigate an anomaly before deciding whether to adjust it. A spike you can explain is one you can plan for next year. A spike you cannot explain may be a real trend.
Add a reason code if you can
For a WooCommerce store, call reasons are usually concentrated: where is my order, return or exchange, a payment or address problem, and product questions. Tagging even a rough reason on each call lets you forecast each type separately, which is valuable because they respond to different triggers. Order status calls follow shipments. Return calls follow deliveries, with a lag. Product questions follow ad traffic.
Choose a forecasting method that fits your size
The academic literature lists many options. Rouba Ibrahim’s survey of call center arrival modeling identifies historical averages, moving averages, exponential smoothing and Holt-Winters, ARIMA, regression, fixed-effects and mixed-effects models, Bayesian methods and dimension-reduction approaches. Which is right depends on your forecast horizon and on which dependencies you must capture: within the day, between days, or across queues.
Here is how that translates for a small store.
| Method | What it does | Best for | Effort |
|---|---|---|---|
| Historical average | Averages the same interval from past weeks | A baseline and a sanity check | Low |
| Moving average | Smooths weekly volume to reveal trend | Stable volume with gradual change | Low |
| Seasonal indices | Multiplies the baseline by a monthly or weekly factor | Retail with a holiday peak | Low to medium |
| Linear regression on weekly totals | Fits a trend line, optionally with event flags | Growing stores with some event history | Medium |
| Exponential smoothing (Holt-Winters) | Weights recent data more, handles trend and season | Stores with 2+ years of clean data | Medium |
| ARIMA, Bayesian, machine learning | Models complex dependencies | Large operations with many queues | High |
The historical average is useful as a reference point even if you go further. Ibrahim’s case study uses past averages to forecast future call volumes, and any fancier model should beat it to justify itself.
On the advanced end, a study of a U.S. commercial bank’s call center applied Bayesian forecasting and reported improvements of up to 25% over classical standards for one-day-ahead forecasts. That is a real gain, but at a bank with thousands of calls a day. Turnella makes the opposite point for smaller operations: complex models are rarely warranted when event data is incomplete, and simple linear regression on weekly totals is often sufficient.
If you handle a few dozen to a few hundred calls a week, start with the first three rows of the table.
Build the forecast step by step
This is the spreadsheet approach. Assembled describes the core idea: a small business can average contact volumes for matching intervals from prior weeks and use a spreadsheet to project future needs.
- Export calls offered by interval. Use 15-minute or 30-minute buckets. For phone and live chat, Assembled recommends granular intervals such as hourly or 15-minute so you can respond to demand spikes.
- Remove or flag anomalies. Keep a separate column for “event” so you can restore them later.
- Forecast weekly volume. Smooth recent weeks with a moving average. Turnella describes a common approach: smooth weekly volume, apply seasonal indices where relevant, then use day-of-week profiles to split the week into days.
- Split days into intervals. Calculate the share of each day’s calls that arrive in each half-hour, using historical proportions. Ibrahim’s case study calls this a top-down approach, and it suits cases where you trust the daily number but your interval data is thinner.
- Layer on events. Add uplifts for promotions and launches (more on this below).
- Convert to staffing. Multiply calls by average handle time to get workload, then decide how many agents, or how much automated capacity, you need in each interval.
A worked example
Say your store averages 240 calls in a normal week, and Tuesday carries 22% of the week, or about 53 calls. Historically 11% of Tuesday’s calls land between 2:00 and 2:30 p.m., so you expect about 6 calls in that half-hour. At a 5-minute average handle time, that is 30 minutes of work: one person fully occupied, with no slack for two calls arriving together. That interval-level view is what a daily total hides.
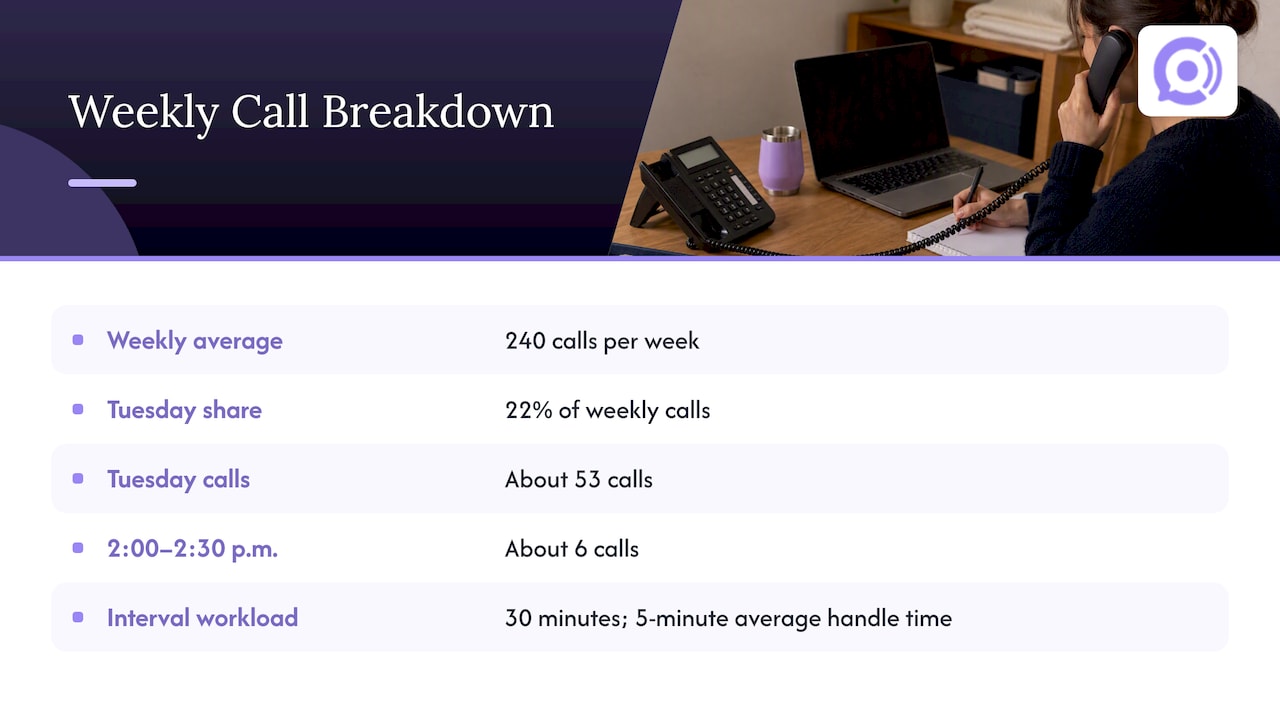
Verint makes the same point: a daily forecast with the right total but the wrong arrival pattern can still produce broken schedules and service-level collapse at peak intervals.
Account for seasons, promotions and spikes
Retail demand is lumpy, and your forecast should treat it that way.
Seasonal indices
A seasonal index is a multiplier. If November call volume has historically run 1.4 times your yearly average, your index for November is 1.4. Compute them from at least a full year, and ideally two, of your own data.
An event calendar
Keep a calendar of everything that moves demand: sales, email sends, ad bursts, product drops, carrier cutoffs. Turnella recommends applying event-specific uplifts, and gives starting ranges of 10 to 40% for campaigns and 15 to 50% for product launches. Treat those as starting points, not rules. After each event, record the actual lift and use your own number next time.
Holiday campaigns deserve their own planning. Execution details such as when gift guides and ads go live shape when calls arrive, and planning holiday ads and operations together helps you place those events on your calendar before the surge, not after it.
Shipping lag
In e-commerce, calls trail orders. A promotion on Monday produces order status calls two to five days later, once customers start wondering where the package is, and return calls a week or two after that. Forecast from orders as a leading indicator if your call history is short. A ratio of calls per 100 orders, tracked weekly, is a surprisingly stable input.
Unexpected spikes
You cannot forecast an outage or a carrier delay, but you can plan the response. Verint advises that when volume runs 15% over forecast, teams should reforecast the rest of the day and adjust schedules using flexible staffing. For a small store, “flexible staffing” might mean a second person on call, or an automated agent that absorbs overflow.
Measure accuracy and keep the forecast honest
Track the gap between forecast and actual by interval and by day. One common formula: accuracy = 100% minus the absolute error divided by actual volume.
HiveDesk cites a benchmark of 90% or higher for daily accuracy and 85% or higher at the interval level, below which schedules may be systematically wrong. Small volumes make percentages noisy: missing by two calls out of six is a 33% error. So judge a small operation over a week or a month, not interval by interval.
The same guide recommends rebuilding forecasts regularly, ideally monthly, and warns that using last week’s volume without adjusting for events or trends is a common failure.
A simple review routine:
- Every Monday, compare last week’s forecast to actuals by day.
- Note the cause of any miss larger than 15%: an event you forgot, a shipping delay, a site change.
- Update your event calendar and seasonal indices with what you learned.
- Rebuild the baseline monthly.
What counts as high call volume?
There is no universal number. High volume is relative to your own forecast and your capacity. A practical definition: any interval where calls offered exceed what your team (or system) can answer within your target wait time. For a one-person team, that can be three simultaneous calls. Verint’s 15%-over-forecast trigger, mentioned above, is a workable alert threshold.
Perspective: change the volume, not only the forecast
Most forecasting advice assumes the calls are a given and the only question is how many people to schedule. In e-commerce support, we see it differently. A large share of phone contacts are routine questions with answers that already sit in your store data: where is my order, what is the return window, did my refund go through. Those calls do not need judgment, they need a lookup.
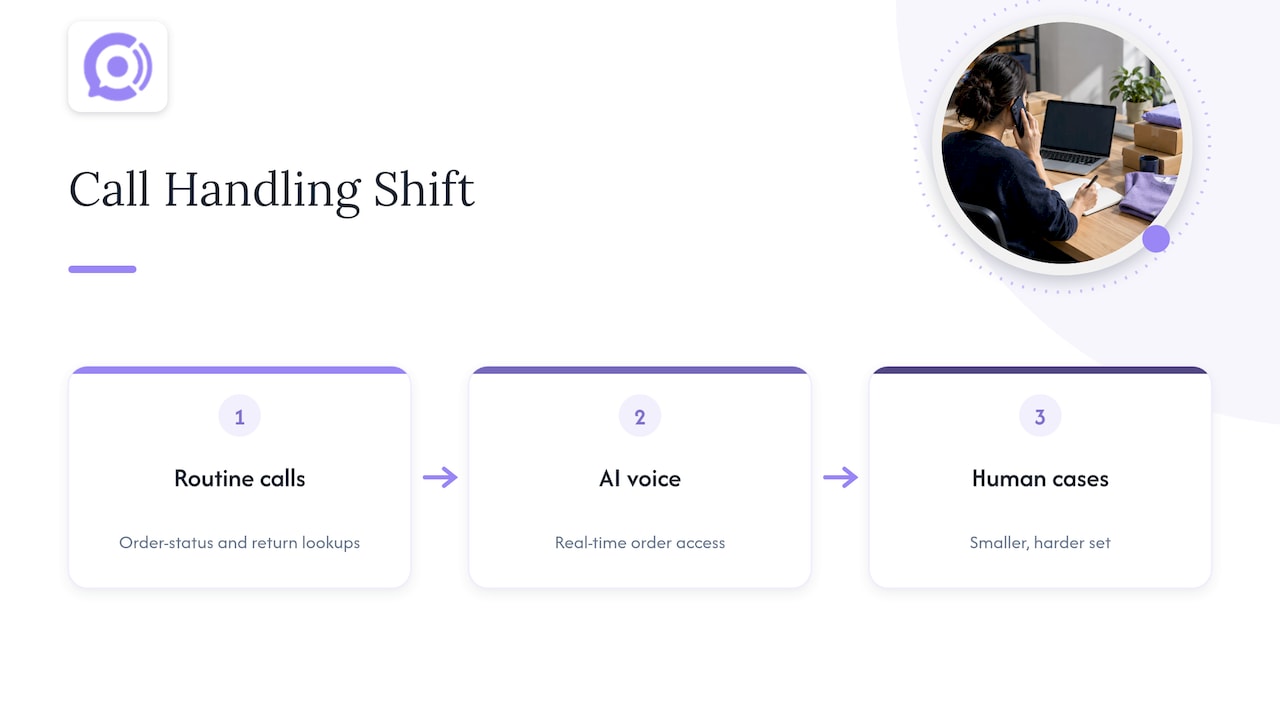
When an AI voice agent with real-time order access answers those calls, the forecasting problem changes shape. Your peaks stop translating into queues, because automated capacity does not run out at 2 p.m. on a Tuesday or on the Friday after a sale. What remains for humans is the smaller, harder set of cases, which is much easier to forecast and staff. Call analytics and transcripts also give you cleaner interval and reason-code data than most small stores ever had, which makes the forecast itself better.
We would still keep the discipline in this guide. A forecast tells you where your volume comes from and when, and that is exactly what you need to decide what to automate first.
— Orphora AI
Using the forecast to decide what to automate
Once you have reason codes and intervals, the automation case is easy to quantify. Take your forecast for next month, split it by call reason, and look at the largest category. For many stores that is order status. Our guide to order tracking automation covers how to stop those calls at the source, and the after-hours support guide covers the intervals when nobody is at the desk. If you want to weigh the economics, the AI voice ROI calculator walkthrough uses seven inputs, several of which come straight from your forecast.
Orphora AI offers voice agents built for WooCommerce stores. The AI Voice Agent plan is $9.99 per month per agent, plus $0.10 per conversation minute, so cost follows your actual call volume instead of a fixed staffing level. Agents read order and customer data in real time, handle order status, returns and shipping questions around the clock, and provide call analytics, recordings and transcripts. You can see the details and get started at orphoraai.com.
If you are still working out how far to take this, the broader piece on scaling support without adding headcount is a good next read.
FAQ
What is the best method for forecasting call volume?
There is no single best method. For most small stores, a moving average of recent weeks, adjusted with seasonal indices and an event calendar, is accurate enough and easy to maintain. Larger operations with clean multi-year data can benefit from exponential smoothing, regression or Bayesian models, as the academic literature on call arrivals describes.
How much historical data do I need?
At least 13 weeks of daily data to start, and 24 to 52 weeks if your business has strong annual seasonality, according to Turnella. Recent 12 to 18 months usually beats a longer history that includes outdated patterns.
Can I forecast call volume in Excel or Google Sheets?
Yes. Put calls by interval in rows, average matching intervals from prior weeks, then apply seasonal and event multipliers. This is the approach Assembled outlines for small teams. Add a column for forecast versus actual so you can track accuracy each week.
How accurate should a call volume forecast be?
One published benchmark is 90% or higher at the daily level and 85% or higher by interval. With very low call counts, expect noisier interval results and judge accuracy over longer periods.
How do I handle a sudden spike in calls?
Reforecast the rest of the day when volume runs well above plan, then shift staffing or route overflow to automated capacity. Afterward, log the cause so the next forecast includes it.
Sources
- Dialpad: Forecasting
- Assembled: How to Build a Workforce Forecasting Process
- Society of Workforce Planning Professionals: Forecasting Fundamentals
- Verint: Call Center Forecasting Methods and Techniques
- Turnella: Contact Volume Forecasting
- Ibrahim: Modeling and forecasting call center arrivals, a literature survey
- Ibrahim: Call center arrivals case study
- Brown, Weinberg and Stroud: Bayesian forecasting of an inhomogeneous Poisson process
- HiveDesk: Call Center Workforce Management guide
- Kontrol Media: Preparing for holiday sales and advertising