

Average Speed of Answer: Formula, Benchmarks, and How to Use It
Learn what average speed of answer (ASA) measures, the formula with a worked example, what counts as a good ASA, and how to use it without being misled.


Average speed of answer (ASA) is the average time callers wait in queue before someone picks up. You calculate it by dividing the total wait time of answered calls by the number of calls answered. A common benchmark runs about 20 to 40 seconds, but the number only means something when you know what your system counts, and when you read it next to service level and abandonment.
This guide covers the definition, the clock start and stop points, the formula with a worked example, how ASA differs from hold time, what a good number looks like, and how a small online store can bring it down without hiring a night shift.
TL;DR
- ASA = total queue delay ÷ number of calls answered. Measure it in seconds, by interval, not just as one monthly number.
- Decide what the clock includes before you compare anything: IVR menu time is usually excluded, ringing time often included.
- A typical benchmark is 20 to 40 seconds, but it only applies to similar operations. Your own trend matters more.
- ASA hides the long waits behind many fast answers. Pair it with service level and abandonment rate.
- If phone volume is dominated by repeat questions like order status, automating those calls lowers wait times for everyone else.
Table of Contents
- What average speed of answer means
- When the ASA clock starts and stops
- The average speed of answer formula
- How to calculate ASA: a worked example
- Does ASA include abandoned calls?
- ASA versus average wait time and hold time
- What is a good ASA for a call center?
- Why ASA alone can mislead you
- What drives ASA up
- How to reduce ASA without overspending
- Our perspective: ASA looks different once routine calls leave the queue
- Where an AI voice agent fits in
- Measuring ASA once calls are automated
- FAQ
- Sources
What average speed of answer means
ASA is a queue statistic from your automatic call distributor (ACD), the system that routes incoming calls to agents. Mitel’s contact center documentation describes it as how long the average caller waits before a queue member answers, including time in queue and ringing time.
In plain terms: a customer finishes the menu, lands in the queue, and the timer runs until a human says hello. Averaged across a day, a week, or a half-hour interval, that is your ASA.
People search for this metric under several names: ASA, average wait time, average queue time. They overlap, but they are not always the same thing, which is why the definition of the clock matters (more on that below).
When the ASA clock starts and stops
This is where most disagreements about ASA come from. Two systems can report different numbers for identical caller experiences because they start or stop the timer at different moments.
The usual conventions:
- Start: when the call enters the agent queue. Time spent in the IVR (the “press 1 for orders” menu) is normally excluded. Federal Student Aid’s guidance to its loan servicers, for example, excludes IVR time and measures caller queue wait.
- Stop: when an agent answers. Some platforms include ringing time at the agent’s desk, as the Mitel definition above does. Carnegie Mellon’s workforce-management material argues that service time should not include IVR or ringing unless the technology hides queue time inside ringing.
There is no single correct choice. There is a correct habit: write down your definition, apply it consistently, and ask any vendor or outsourcer to state theirs before you compare reports.
The average speed of answer formula
The International Customer Management Institute (ICMI) defines it in a contact center metrics white paper as total delay divided by the total number of calls:
ASA = total queue delay ÷ total number of calls answered
Delay is measured in seconds from queue entry to answer. Which calls go in the denominator is the part people get wrong, so see the abandoned-calls section below.
How to calculate ASA: a worked example
Say your store’s phone line handled one Monday in the busy season. Here are four half-hour intervals pulled from the call report (illustrative numbers):
| Interval | Calls answered | Total queue wait (seconds) | ASA (seconds) |
|---|---|---|---|
| 9:00 to 9:30 | 20 | 400 | 20 |
| 9:30 to 10:00 | 30 | 900 | 30 |
| 10:00 to 10:30 | 25 | 1,250 | 50 |
| 10:30 to 11:00 | 25 | 450 | 18 |
| Total | 100 | 3,000 | 30 |
The day’s ASA is 3,000 ÷ 100 = 30 seconds. Note that you divide total wait by total calls, not average the four interval ASAs. Here those happen to match closely, but with uneven volume they will not. A simple average of 20, 30, 50 and 18 gives 29.5, and the gap widens as intervals get lopsided.
Three steps to repeat it on your own data:
- Export queue wait time per answered call (or total wait per interval) from your phone system.
- Sum the wait seconds and count the answered calls for the same period.
- Divide, then repeat by hour of day and day of week. The intraday pattern is where the actions are.
If your platform only reports an overall ASA, ask whether it can show a half-hour breakdown. A 30-second daily ASA can contain a 4-minute wait at lunchtime.
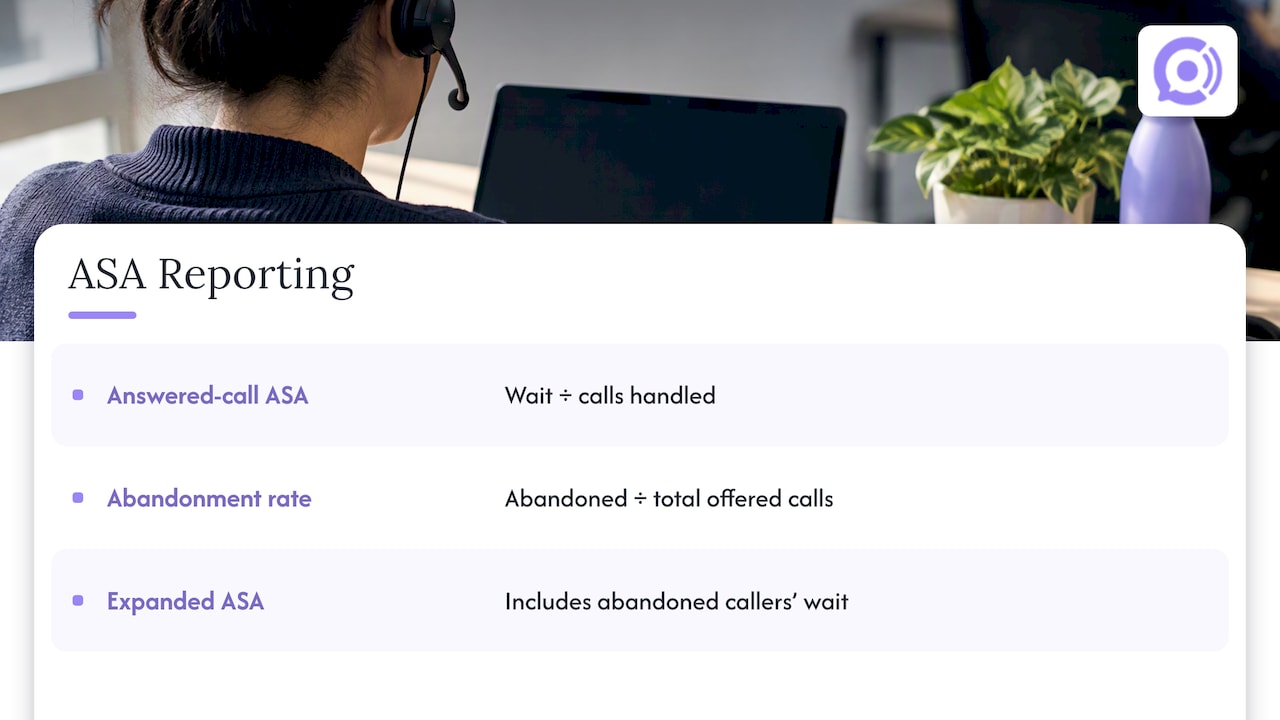
Does ASA include abandoned calls?
Usually not, and this is a definitional choice worth confirming. Federal Student Aid’s wording divides caller wait by calls handled, or by callers who take a callback offer and leave the queue, so the denominator is defined explicitly rather than being all callers who ever dialed.
Many ACD reports measure ASA on answered calls only, so callers who hang up after three minutes do not push the average up. That makes ASA look better exactly when the experience is worst. If 20 callers abandon after long waits and are not counted, your ASA can look healthy while customers walk away.
The fix is simple: always report the abandonment rate (abandoned calls ÷ total offered calls) beside ASA, and consider a second view of the metric that includes abandoned callers’ wait time.
ASA versus average wait time and hold time
These terms get swapped constantly, but they measure different moments:
| Metric | What it measures | Where the clock runs |
|---|---|---|
| ASA | Wait before an agent first answers | Queue entry to agent pickup |
| Average wait time | Often the same, but may include abandoned callers or IVR | Varies by system |
| Average hold time | Time a caller is placed on hold by an agent mid-call | After the call is answered |
| Average handle time | Talk plus hold plus after-call work | Pickup to wrap-up |
Ask of any report: is this before or after the human answered? ASA is always before. Hold time is always after.
What is a good ASA for a call center?
The commonly quoted range is 20 to 40 seconds, and one benchmarking guide stresses that such figures should be compared against similar operations and read alongside service level, abandonment, staffing, adherence, and occupancy, not treated as universal targets.
That caution is right. What counts as good depends on:
- Urgency of the call. A caller reporting a fraud alert tolerates less waiting than someone asking about a return label.
- Channel expectations. Phone callers expect an answer faster than email senders.
- Your cost per call. Cutting ASA from 40 to 20 seconds can mean far more staffed hours than going from 90 to 60.
- Your customers. Online shoppers calling about a delayed package are often already annoyed. They notice waits.
For a small WooCommerce store, a realistic first goal is not a number from a blog. It is: find your worst interval, see what is causing it, and bring that interval in line with your best one.
Why ASA alone can mislead you
ICMI explains that ASA comes from the same data as service level but does not represent a typical caller’s experience: many calls may be answered quickly while a smaller number wait much longer. The average smooths over the pain.
Here is how that looks in practice. Ninety calls answered in 10 seconds and ten calls answered after 5 minutes produce an ASA of 39 seconds. That is “normal” on paper. Yet one caller in ten waited five minutes, and those are the people who leave a one-star review.
So pair ASA with:
- Service level: the percentage of calls answered within a threshold. The classic version is 80% within 20 seconds, though thresholds vary by operation.
- Abandonment rate: the share of callers who hang up before reaching an agent.
- Longest wait in queue: the worst-case experience in the interval.
- Quality signals: first contact resolution and customer satisfaction, so a faster answer is not bought with rushed calls.
The same trap runs in reverse. Chasing a very low ASA can push agents to cut calls short or leave costly idle capacity. For a wider look at the metrics that sit around ASA, see this overview of call center performance metrics and how first contact resolution and satisfaction fit with speed.
What drives ASA up
High ASA is nearly always a staffing-to-demand mismatch, rather than lazy agents. The common causes:
- Forecasts that miss call volume. Carnegie Mellon’s workforce-management guidance ties ASA and service level results to the forecast of call volume and the handling-time assumptions behind staffing. If actual calls run longer than assumed, the queue grows even with the right headcount on the schedule.
- Spikes you did not plan for. A shipping delay, a promotion, or a holiday cutoff sends a wave of calls in an hour.
- Repetitive, low-complexity calls. “Where is my order?” can fill a queue and block the caller who needs a person for a damaged item.
- Thin coverage off-hours. A one-person team cannot cover lunch, evenings, and weekends.
- Slow tools. Agents who switch between the store admin, a carrier site, and a spreadsheet to find a tracking number stretch handle time, which stretches the queue.
How to reduce ASA without overspending
The research-backed method is not exotic. Use accurate call-volume forecasts and handling-time assumptions to work out how many agents you need, build a matching schedule, and compare results with what you expected. Then act on the gap.
A practical order of operations for a small store:
- Measure by interval. Pull ASA, abandonment, and call count by half hour for four weeks.
- Categorize the calls. Sample 100 calls or transcripts and tag the reason. Order status, return status, shipping times, and policy questions often dominate.
- Remove the repeatable calls from the human queue. Self-service, better order emails, and automated phone handling all work. Our guide on stopping WISMO calls with order tracking automation goes through this one in detail.
- Route by issue, not by habit. Some problems are better on chat, some need a phone. See how to choose chat versus phone support.
- Schedule to the real curve. Put people where the half-hour data says calls arrive.
- Protect the handoff. When automation passes a call to a person, the caller should not repeat everything. We cover escalation rules that avoid repeat explanations.
- Watch quality. A faster pickup is no win if resolution drops. Reviewing calls systematically, as in call quality monitoring with AI triage, keeps you honest.
Our perspective: ASA looks different once routine calls leave the queue
We build AI voice agents for WooCommerce stores, so we see ASA from a particular angle. For most small online retailers, the queue is not full of hard problems. It is full of the same few questions: where is my order, how do I return this, when will it ship. Each takes a human a minute or two, and together they create the wait that hits the customer with a real problem.
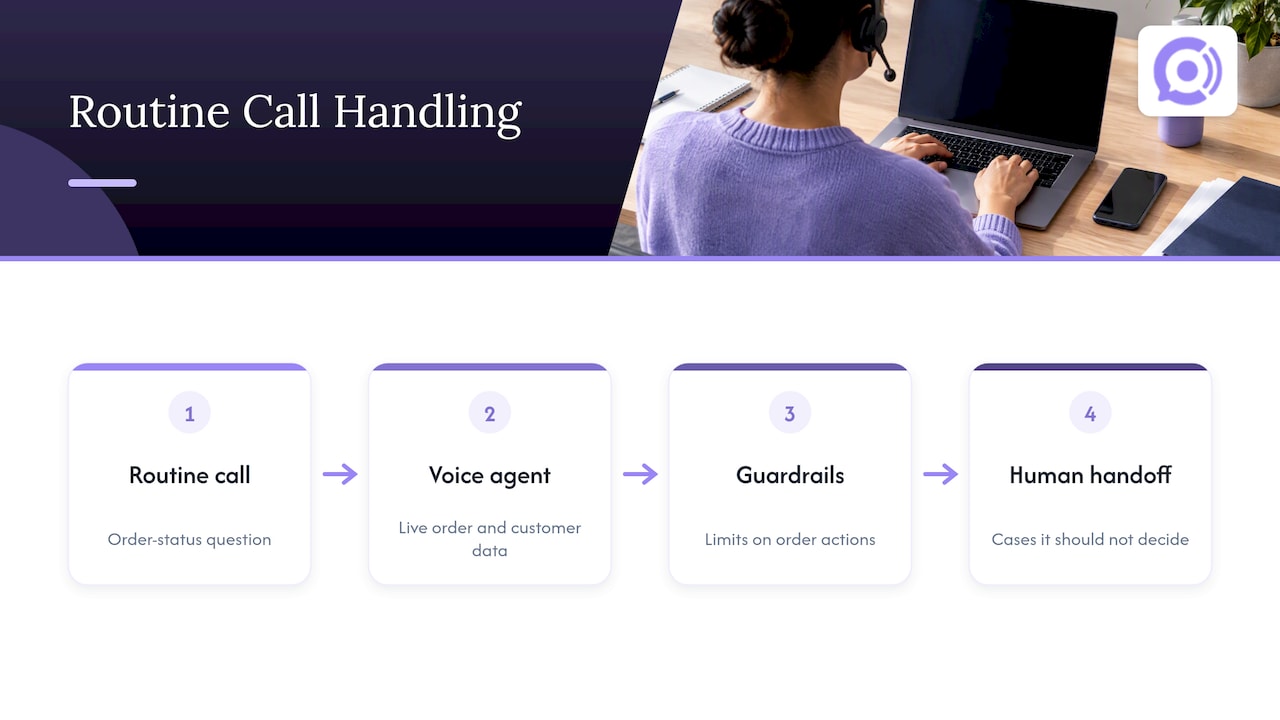
Our view is that the cleanest way to improve ASA is to stop making routine callers wait for a person at all. A voice agent connected to live order and customer data can answer an order-status call in conversation, within guardrails for any action on an order, and hand off the cases it should not decide. The humans left in the queue then handle fewer, more meaningful calls.
We would also say this plainly: do not adopt automation to make a number look good. Test it. Check whether the agent gets order numbers, return codes, and policies right (our approach to testing voice AI accuracy), and keep tracking abandonment and satisfaction alongside speed. The aim is a caller who gets the right answer quickly, not a prettier dashboard.
— Orphora AI
Where an AI voice agent fits in
If phone calls to your WooCommerce store are mostly order status, returns, and shipping questions, an Orphora AI voice agent can take those calls around the clock. Pricing is published as $9.99 per month per agent plus $0.10 per conversation minute, and an Enterprise plan is available for larger needs. You can estimate whether it pays off with our seven-input WooCommerce payback calculation, and review shipping policy checks before calls go live so the agent answers from correct rules.
Measuring ASA once calls are automated
Automation changes what ASA means. If an AI agent answers instantly, a blended ASA across all calls can look excellent and tell you nothing about the human queue. Keep two views:
- Human-queue ASA: for calls that reach a person, including escalated ones.
- Containment and resolution: the share of automated calls fully resolved, and how many were escalated.
Report them separately. Call transcripts and recordings let you verify what happened, and if you record calls, plan for consent and retention rules first with a call recording compliance plan.
FAQ
How do I calculate average speed of answer?
Add up the queue wait time, in seconds, of every answered call in your period, then divide by the number of answered calls. For example, 3,000 seconds of total wait across 100 answered calls gives an ASA of 30 seconds. Run it by half-hour interval as well as by day.
What is a good ASA for a call center?
A frequently cited benchmark is 20 to 40 seconds, but it should be compared with similar operations and read with service level and abandonment. For a small store, improving your worst interval matters more than hitting a published figure.
Does ASA include abandoned calls?
Often it does not, because many systems measure answered calls only. Definitions differ, so check your platform’s report notes. Always track abandonment rate next to ASA so long waits that ended in a hang-up do not disappear from view.
What is the difference between ASA and average hold time?
ASA measures the wait in queue before an agent first answers. Hold time measures how long an agent keeps a caller waiting after the call has connected. They need different fixes: staffing and routing for ASA, tools and training for hold time.
Is ASA the same as service level?
No. ASA is an average. Service level is the percentage of calls answered within a target time. ICMI notes that service level gives a clearer indication of caller experience because an average can hide a long tail of slow answers.
Sources
- ICMI white paper on call center metrics and KPIs
- Mitel MiContact Center Business terms and definitions
- Federal Student Aid average speed to answer definition (Senate letter)
- Carnegie Mellon workforce-management paper
- Call center productivity benchmarks guide