

Self-Service Rate: Formula, Benchmarks, and How to Improve It
Learn how to calculate self-service rate, how it differs from IVR containment and repeat contact rate, what a good number looks like, and how to raise it.

Self-service rate is the share of customer issues that get resolved without a live agent. The basic formula is self-service resolutions divided by total incidents, multiplied by 100. The number only means something when you define “resolved” strictly, and when you read it next to its two companion metrics: IVR containment rate and repeat contact rate. This guide shows how to calculate all three for a WooCommerce store, what benchmarks exist, and where the metric misleads.
TL;DR
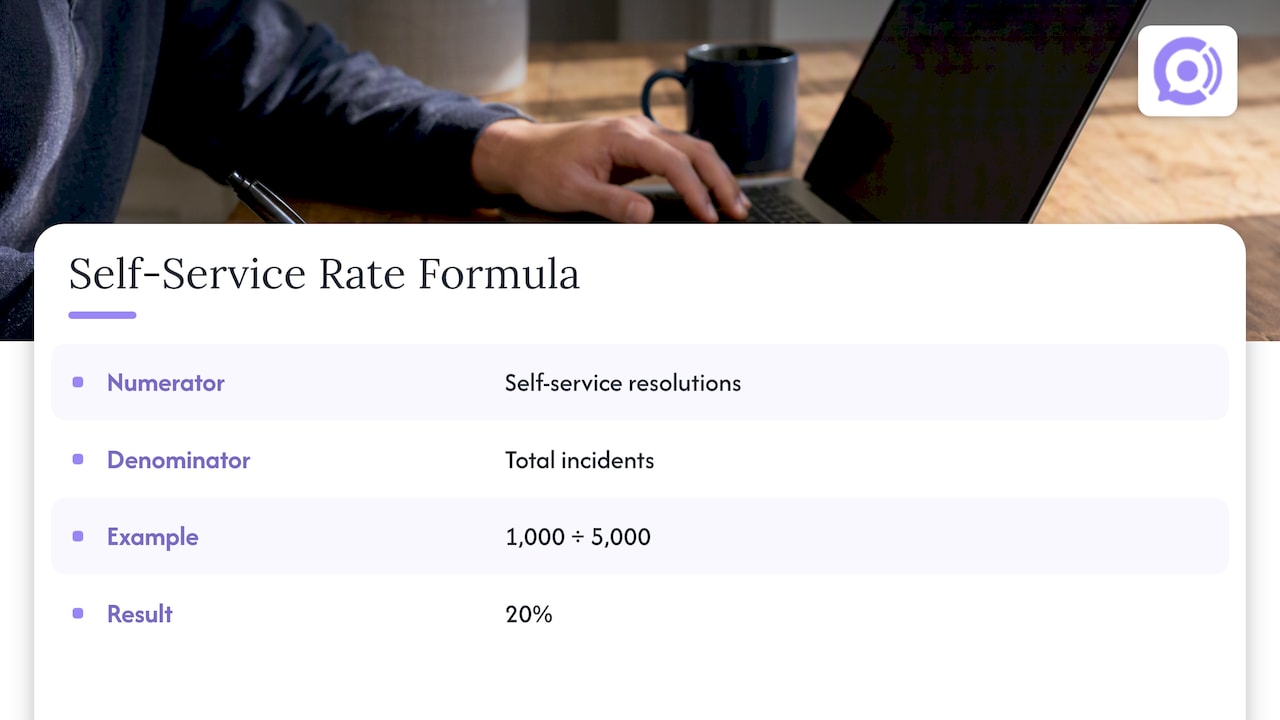
- Formula: self-service rate = issues resolved in self-service ÷ total issues × 100. HDI’s worked example: 1,000 self-resolved out of 5,000 total is 20%.
- Benchmarks are low and wide. MetricNet’s worldwide service-desk data averages 10.4%, with a range from 0% to 55%, and it is driven mostly by password resets. Your store’s mix of questions will look different.
- Containment is not resolution. A caller who hangs up in frustration inside your phone menu is not a success. Track completed and abandoned sessions separately.
- Pair it with repeat contact rate. If customers come back about the same order within days, the self-service “win” was not one.
- For e-commerce, start with order status and returns. They are high-volume, repetitive, and answerable from order data.
Table of Contents
- What self-service rate means in customer support
- How to calculate self-service rate
- What is a good self-service rate?
- IVR containment rate: how it differs from self-service rate
- IVR abandonment rate: what it tells you
- Repeat contact rate and repeat call rate
- How the three metrics fit together
- How to improve your self-service rate
- Our perspective
- Put it to work on your phone line
- FAQ
- Sources
What self-service rate means in customer support
Self-service rate describes how often customers solve a problem or complete a task on their own, through a help center, an order portal, a chatbot, or an automated phone line, instead of reaching a person. Vendors and analysts also call it self-service completion rate or self-service resolution rate. The names differ, but the idea is the same: of everyone who had a need, how many were served without staff time?
For a store owner, it answers a practical question. If 500 customers a month ask where their order is, how many of them get a correct answer without anyone on your team lifting a finger? Every one that does is time returned to your team and a faster answer for the customer.
The metric has a quiet trap, though: the word “self-service” covers very different channels. A knowledge base article, a tracking page, and an automated phone agent all count, but they behave differently and fail differently. Measure them separately before you blend them into one headline number.
How to calculate self-service rate
The simplest version, as HDI describes it, divides incidents resolved through self-service by total incidents. Its example: 1,000 self-service resolutions out of 5,000 total incidents gives a 20% self-service completion rate.
That formula hides two decisions you have to make.
Decide what the denominator is
There are two common denominators, and they produce very different numbers:
| Version | Numerator | Denominator | What it tells you |
|---|---|---|---|
| Share of all issues | Issues resolved in self-service | All issues, self-service and assisted | How much of your total demand never reaches a person |
| Share of attempts | Issues resolved in self-service | Everyone who started a self-service session | How well your self-service tools work once someone tries them |
The first is a business metric: it tracks workload. The second is a quality metric: it tracks whether the tool works. A store can have a low first number (few customers know the tool exists) and a high second number (the ones who try it succeed). Those two situations need opposite fixes, more promotion in the first case and better answers in the second.
Decide what counts as resolved
A session that ends is not necessarily a session that succeeded. Count a self-service resolution only when at least one of these is true:
- The customer reached the end of a defined task, such as getting an order status or starting a return.
- The customer confirmed the answer helped, in a post-session prompt or a keypress.
- The customer did not contact you again about the same issue through any channel within a set window.
The third condition is the most honest, and it is why repeat contact data belongs next to your self-service rate.
A worked example for a WooCommerce store
Say your store receives 1,200 contacts in a month across phone, email, and chat. Of those, 400 were handled entirely by automation and ended with a completed task. Of those 400, 40 customers contacted you again within seven days about the same order.
- Raw self-service rate: 400 ÷ 1,200 = 33.3%
- Adjusted for repeats: (400 − 40) ÷ 1,200 = 30%
The adjusted figure is the one to report to yourself. The gap between the two tells you how much of your “success” was really a postponed contact.
What is a good self-service rate?
There is no universal answer, and published figures should be read as ranges, not targets.
HDI’s summary of MetricNet data reports a worldwide average self-service completion rate of 10.4% for service desks, with individual desks anywhere from 0% to 55%. The same source notes that most self-resolved incidents are password resets. That detail matters: an IT help desk has one huge, perfectly automatable request. An online store does not have a password-reset equivalent, but it does have one that comes close, which is “where is my order?”
Two things follow for e-commerce:
- Your ceiling depends on your mix of questions. If most contacts are order status, shipping windows, and return eligibility, a high rate is achievable because the answers sit in your order data. If most are damaged-item disputes, custom orders, or fit advice, the ceiling is lower, and that is fine.
- Benchmark against yourself first. Track your own rate monthly, by intent, and watch the direction. A move from 12% to 25% in a quarter, with stable repeat contacts, is a real result no matter what an industry average says.
HDI also offers a perspective worth remembering: when self-service removes the simple incidents, the contacts that still reach agents are more complex on average, so cost and handling time per assisted contact tend to rise. Do not read a longer average handle time as a failure. It is often the sign that automation is taking the easy work.
IVR containment rate: how it differs from self-service rate
IVR containment rate is the phone-specific cousin of self-service rate. It measures the share of calls that start in the automated phone system and finish there, without being transferred to a person. Self-service rate is broader (it spans every channel) and, done well, asks whether the problem was actually solved. Containment only asks whether the call stayed inside the system.
That difference is where the damage happens. A caller who gives up and hangs up inside the menu is “contained.” A caller who is looped through the wrong options and abandons the call is also “contained.” Both inflate the metric.
The U.S. Postal Service’s Office of Inspector General made this point about its own automated phone line, recommending separate tracking for complete, contained calls and for incomplete, abandoned calls, so that abandoned sessions are not counted as successes.
A practical way to apply that to your own phone support:
| Call outcome | Counts toward containment? | Counts as self-service success? |
|---|---|---|
| Caller got order status and ended the call after the answer | Yes | Yes |
| Caller started a return, completed it, and got a confirmation | Yes | Yes |
| Caller hung up mid-menu or mid-conversation | Only in a naive count | No |
| Caller transferred to a person | No | No |
| Caller got an answer, then called back the next day about the same order | Yes | No, once repeats are subtracted |
If your phone provider or agent platform reports a single “containment” number, ask how it treats the third and fifth rows.
IVR abandonment rate: what it tells you
Abandonment is the opposite signal: customers leaving before they get what they came for. Definitions vary. The most common one, as TechTarget explains, counts calls sent into a staff queue that hang up before an agent answers, and some centers exclude calls that end within roughly 5 to 20 seconds, on the theory that they are misdials or instant hang-ups.
For an IVR, you want a second, related measure: abandonment inside the automated flow itself. A rising rate there usually points to one of a few causes:
- Too many menu levels before the caller reaches the thing they need
- A greeting or prompt that is too long
- Recognition errors that force callers to repeat themselves
- No obvious way to reach a person when the automation cannot help
The last one deserves emphasis. Self-service that traps customers is worse than none. Build an exit to a human into every flow, and make it pass along what the caller already said. We cover the rules for that in our guide to AI-to-human escalation.
Repeat contact rate and repeat call rate
Repeat contact rate is the share of contacts where the same customer comes back about the same issue within a defined window. Many teams use a window of around seven days, though you should pick one that matches your product: for a store with 3 to 5 day shipping, a window shorter than the delivery time will miss follow-ups. When you count only phone calls, the same measure is usually called repeat call rate.
This is the check on your self-service rate. If both numbers climb together, customers are using the automation and still not getting what they need.
The common sources of repeats in e-commerce are predictable:
- Incomplete answers. The customer learns the order shipped but not when it arrives.
- Missing context. A customer reaches a person after automation and has to start over.
- Actions that do not finish. A return is “started” but no label arrives.
- Channel mismatch. The customer asked on the phone, got an answer, and then emails to get it in writing.
Order context is the strongest lever here. When every channel can see the same order, the same history, and the same status, customers stop re-asking. Our piece on omnichannel support and order context goes through how. For the longer-term effect of fixing these friction points on retention, see this walkthrough on building customer loyalty step by step.
A note on benchmarks: you will find repeat contact figures in many vendor blogs, and they vary widely by how each one defines the window and the channel. Treat them as rough context, and set your own baseline from your help desk data before you set targets.
How the three metrics fit together
Use them as a set, not as separate scoreboards.
| Metric | Question it answers | Watch out for |
|---|---|---|
| Self-service rate | How much demand never needs a person? | Counting sessions that merely ended |
| IVR containment rate | How many calls stay inside the phone automation? | Abandoned calls counted as wins |
| IVR abandonment rate | Where do callers give up? | Inconsistent definitions, short calls |
| Repeat contact / repeat call rate | Did the answer stick? | A window that is too short |
A healthy pattern looks like this: self-service rate rising, abandonment inside the flow falling, repeat contact rate flat or falling. An unhealthy one: containment rising while repeat calls rise too. That means your automation is absorbing calls without resolving them.
How to improve your self-service rate
Work in this order. Each step makes the next one measurable.
- Tag every contact by intent. Without categories (order status, return request, shipping cost, product question, damaged item), you have one blended number that hides everything. Pull a month of tickets, call logs, and emails and sort them.
- Rank intents by volume and by how automatable they are. Order status and return initiation are almost always at the top for a WooCommerce store, because the answer lives in your order data.
- Automate the top two or three first. Do not try to cover everything. A narrow flow that finishes the job beats a broad one that half-answers.
- Define success per intent. Order status is a success when the customer gets status and an expected date. A return is a success when the customer receives instructions or a label.
- Add a clean exit. Make it easy to reach a person, and pass along the context.
- Measure repeats at seven days (or your own window). Fix the intents with the worst repeat rates before adding new ones.
- Review transcripts weekly. The failed sessions are your roadmap. If you record calls, make sure you follow the rules in our call recording compliance plan, and use AI triage for call quality monitoring so reviewing does not become a full-time job.
For the phone channel specifically, response time is the first thing customers feel. If you want to see how long callers wait today, start with average speed of answer and our guide to reducing response time in e-commerce support. If you are deciding which channel to automate first, SMS versus voice lays out the tradeoffs.
Our perspective
We build voice agents for WooCommerce stores, so we look at self-service rate from the phone side, and we have a strong view on it: the number that matters is resolved calls, not handled calls.
A phone menu that says “press 1 for order status” is technically self-service, but it asks the customer to do the work and often to find an order number they do not have handy. A voice agent connected to your order data can look up the order from what the caller says, give the status, and answer the follow-up in the same call. That is the design goal behind our agents: real-time access to order and customer data, natural conversation without the lag customers hate, and guardrail workflows for order actions so the agent does only what you have approved.
We also think the industry measures this too generously. If a platform reports containment, ask what happens to callers who abandon, and ask for repeat call data next to it. The right target is not the highest containment number. It is the highest share of calls that end with the customer’s problem solved and no second call.
Finally, self-service should not mean fewer humans for their own sake. It means your people spend their time on the cases that need judgment. Our thinking on that is in how to scale support without scaling headcount.
— Orphora AI
Put it to work on your phone line
If phone calls are the part of your support that still needs a person for every order-status question, that is the fastest place to move your self-service rate. Orphora AI voice agents connect to WooCommerce, look up orders in real time, handle returns and shipping questions, and answer around the clock. Call analytics, recordings, and transcripts are included, so you can calculate containment, abandonment, and repeat calls from your own data.
Pricing is published: $9.99 per month per agent plus $0.10 per conversation minute. An Enterprise plan is available without a published price.

Before you launch, decide what to customize first, from greeting to escalation rules. If you want the broader picture of how AI fits into store support, our guide to AI customer service for e-commerce covers it.
FAQ
What does self-service rate mean?
It is the percentage of customer issues resolved without a live agent, using tools such as help articles, order-tracking pages, chatbots, or automated phone lines. You calculate it by dividing self-service resolutions by total issues. Define “resolved” carefully, or the number will overstate your success.
How is self-service rate different from IVR containment rate?
Self-service rate covers all channels and, ideally, counts only issues actually solved. IVR containment covers only phone calls and counts any call that did not transfer to a person. Because that includes callers who gave up, the USPS Inspector General recommends separating completed and abandoned calls.
What is a good self-service rate for an online store?
No single benchmark fits. Service-desk data from MetricNet averages 10.4% with a 0% to 55% range, but that mix is dominated by password resets. For a store, set a baseline by intent, then aim to raise it each quarter while repeat contacts stay flat or fall.
How do repeat call rate and repeat contact rate differ?
Repeat contact rate counts customers who come back about the same issue through any channel within a set window. Repeat call rate counts only phone calls. Use the broader measure to judge self-service, because customers often switch from phone to email after an unsatisfying answer.
Does a higher self-service rate always mean better support?
No. It is only good news if abandonment stays low and repeat contacts do not rise. A higher rate can also leave your remaining agent contacts more complex, which HDI notes can raise the cost per assisted contact.
Sources
- Metric of the Month: User Self-Service (HDI)
- Self-Service Completion Rate (HDI)
- 1-800-ASK-USPS: The Postal Service’s Interactive Voice Response System (USPS OIG)
- How to calculate abandoned call rate for a contact center (TechTarget)